Key Findings
- Urban, metropolitan counties were more resilient than rural counties.
- Micropolitan counties were most resilient.
- Access to resources from metropolitan and micropolitan areas increased COVID-19 resilience.
- Leveraging a “better together” approach increases COVID-19 resilience.
Resiliency researchers analyzed COVID-19 data with first-of-its-kind approach
Researchers at Texas State’s Community Health and Economic Resiliency Research (CHERR) Center of Excellence wanted to understand which Texas counties were most resilient during the early days[1] of COVID-19 to identify best practices for future public health emergencies. Five[2] micropolitan counties[3] rose to the top.
To identify county resilience, researchers used a proprietary computer algorithm[4] developed by Texas State researchers to analyze COVID-19 trends[5] across Texas counties[6]. The algorithm assigned a resilience score to each county in Texas. Higher resilience scores indicate lower levels of COVID-19 spread across counties.
Unlike many other researchers who focus on individual units of data (i.e., COVID counts over time), the algorithm used a first-of-its-kind network approach to provide a more realistic view about how COVID-19 patterns change over time.
The algorithm assigns resilience scores based on COVID-19 levels within each county, while also considering that county’s relationship to other counties. This approach focuses on the connected nature of communities (i.e., people traveling within their county to the store, people traveling to other counties for work, etc.), allowing for a more robust understanding of the spread of COVID-19 across counties.
“Pandemics don’t know borders; they don’t follow rules – pandemics happen freely across county lines. That’s why we’re using a network approach. We aren’t just analyzing COVID counts over time, but rather studying the interconnected, networked nature of communities during a pandemic,” said Dr. Lucas Rusnak.
Researchers used economic data to better understand county resilience
Researchers first incorporated population size and density into the algorithm to understand if there was an association to COVID-19 resilience. Results surprisingly showed population was not related to county-resilience.
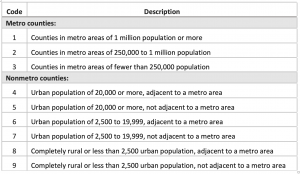
As a follow up, researchers incorporated county-level data known as RUCC scores[7] to measure the degree of urbanization of each county.
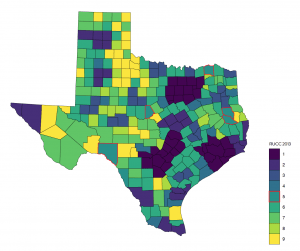
RUCC scores are calculated using economic data including population density, degree of urbanization, commuting flows, and adjacency to a metropolitan area. In the RUCC system, a score of 1 is the most urban while a score of 9 is the most rural. Unlike population alone, RUCC scores offer a more nuanced understanding of how counties function by incorporating other types of data – the commuting and urban adjacency data is especially important for public health researchers because it accounts for the movement of people in and out of counties.
“To really understand COVID over time, we can’t just look at population counts alone because they ignore the interconnected nature of communities. Each morning cities breathe in commuters from surrounding areas and breathe them back out again each evening,” said Dr. Adam Vaughan. “That’s one reason RUCC data works so well here – because it accounts for commuters and their proximity to the cities they travel to,” said Vaughan.
Resilience is about resources
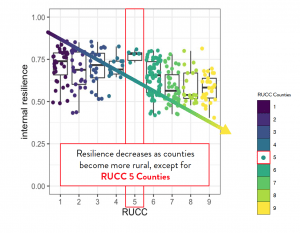
Researchers found RUCC scores were correlated to resilience. Counties with lower RUCC scores (urban counties or those within commuting distance to urban counties) were more resilient than those with higher RUCC scores (rural counties outside of commuting distance to urban counties).
“That’s when we realized resilience isn’t about how rural or urban a county is – it’s about the county’s proximity to resources. Even if I’m in a rural county, if I can drive 20 minutes down the road to my urban neighbor county, I’m going to benefit from being able to access resources like medical care when I urgently need it,” said PhD student Maria Tomasso.
Unlike population alone, RUCC scores correlate to resilience because they consider other important aspects like the interconnected and fluid nature of our communities.
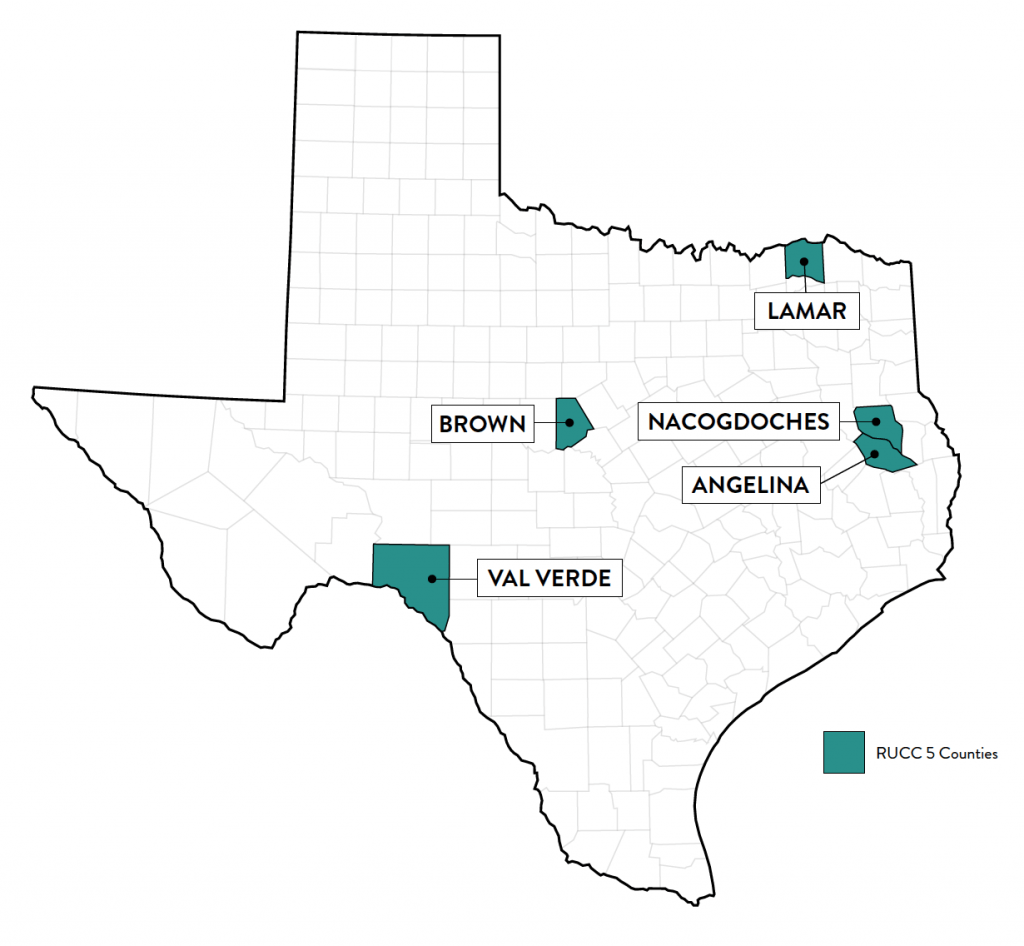
Five micropolitan counties rose to the top
There was one interesting exception to the resilience finding – RUCC 5 counties in Texas were equally or more resilient than RUCC 1 counties during the first 225 days of COVID-19. RUCC 5 counties do not share any borders with metropolitan areas. They are “micropolitan islands” with a population of 20,000 or more, but not within commuting distance to a metropolitan area.
Although further research is needed to fully understand factors that made RUCC 5 counties most resilient, preliminary evidence suggests their isolation from more urban areas could play a role in their success.
“A limited number of people travel in and out of RUCC 5 counties each day. This potentially helped contain the spread of COVID-19 and made it easier to be resilient because these counties have a good understanding about the resources needed by their residents.” Melinda Villagran, CHERR Director.
Compared to other counties, RUCC 5 counties were also best able to support their neighbors over the first 225 days of the pandemic. RUCC 5 counties not only helped themselves, but they were able to help rural neighbor counties who likely rely on them for resources.
A better together approach encourages resilience
Research demonstrated COVID-19 resilience is not related to population or urbanization – instead, it’s about access to resources. Urban areas were more resilient because they typically have more resources. Additionally, counties adjacent to urban areas were more resilient than those who are isolated from urban areas because they have the benefit of accessing urban resources when needed.
Although RUCC 5 counties are not adjacent to urban areas, it’s likely these unique micropolitan areas developed resilience as a result of being historically isolated from urban areas. RUCC 5 counties also helped others by serving as the resource hub for their rural neighbor counties.
The key to resilience is working together, not in isolation of each other.
Recommendations for stakeholders
- For state lawmakers: Consider the impact of local population centers, especially RUCC 5 counties, during preparedness and resiliency planning. Work with neighbor states to understand resource availability and potential to share/support each other during public health emergencies.
- For public health researchers: Consider leveraging a network-based model or at least the interconnected nature of community relationships when analyzing COVID-19 or other public health data.
- For public health communicators: Encourage a “better together” approach when communicating preparedness messaging with community members.
- For city-level planners: Work with neighbor counties to understand resource availability and potential to share/support each other during public health emergencies.
- For the Texans everywhere: Leverage a better together approach to support each other. Talk to your immediate neighbors to understand resource availability in your neighborhood.
About the research team
CHERR believes interdisciplinary research yields the highest value public health research because it considers the inter-connected and complicated nature of communities. Work in this paper is brought to you by CHERR faculty fellow researchers, Dr. Lucas Rusnak, Department of Mathematics, College of Science and Engineering; Dr. Adam Vaughan, School of Criminal Justice and Criminology; and Maria Tomasso, Computer Science PhD Student.
Click here to download this report
Footnotes
[1] The first 225 days of COVID starting January 22
[2] Texas has a total of six micropolitan counties, but Maverick was an outlier, so it has been excluded from this report.
[3] Angelina, Brown, Lamar, Nacogdoches, Val Verde
[4] The algorithm works by engaging in a scenario-planning simulation to model potential positive or negative changes in COVID-19. Contact Dr. Lucas Rusnak at lr27@txstate.edu for more information.
[5] CDC COVID-19 Trends Data: https://usafacts.org/visualizations/coronavirus-covid-19-spread-map/
[6] US Census County Adjacency Data: https://www.census.gov/geographies/reference-files/2010/geo/county-adjacency.html
[7] Table 1: RUCC score descriptions
Table 1: RUCC score descriptions